

pprof 是什么
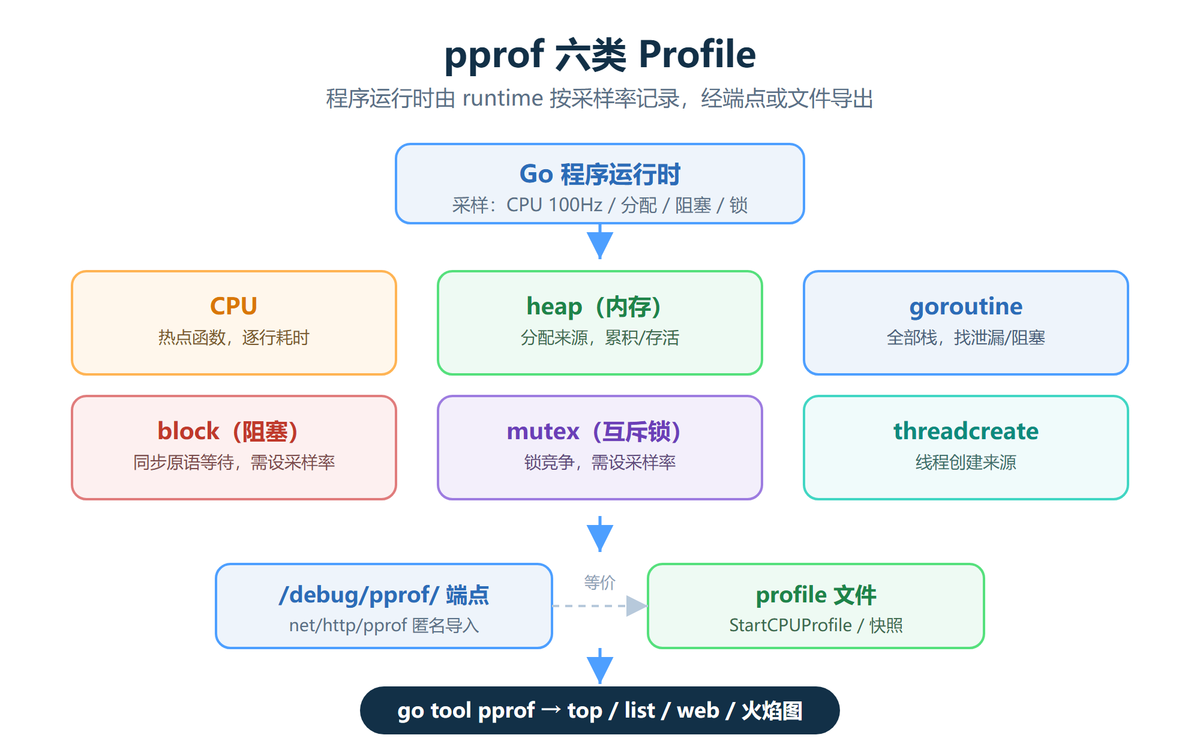
pprof 是 Go 内置的性能分析工具,由 runtime 采样、go tool pprof 分析。它覆盖六类数据:CPU 耗时、内存分配、goroutine 栈、阻塞、锁竞争、线程创建。定位性能问题先看它,不用装第三方库。
快速开始
导入 net/http/pprof 并起一个 HTTP 服务即可:
import _ "net/http/pprof"

go func() {
    log.Println(http.ListenAndServe("localhost:6060", nil))
}()
浏览器访问 localhost:6060/debug/pprof/ 能看到所有入口:
http://localhost:6060/debug/pprof/          // 总览
http://localhost:6060/debug/pprof/heap      // 内存
http://localhost:6060/debug/pprof/profile?seconds=30  // CPU,采集30秒
http://localhost:6060/debug/pprof/goroutine?debug=2   // goroutine 堆栈
命令行分析
CPU 分析
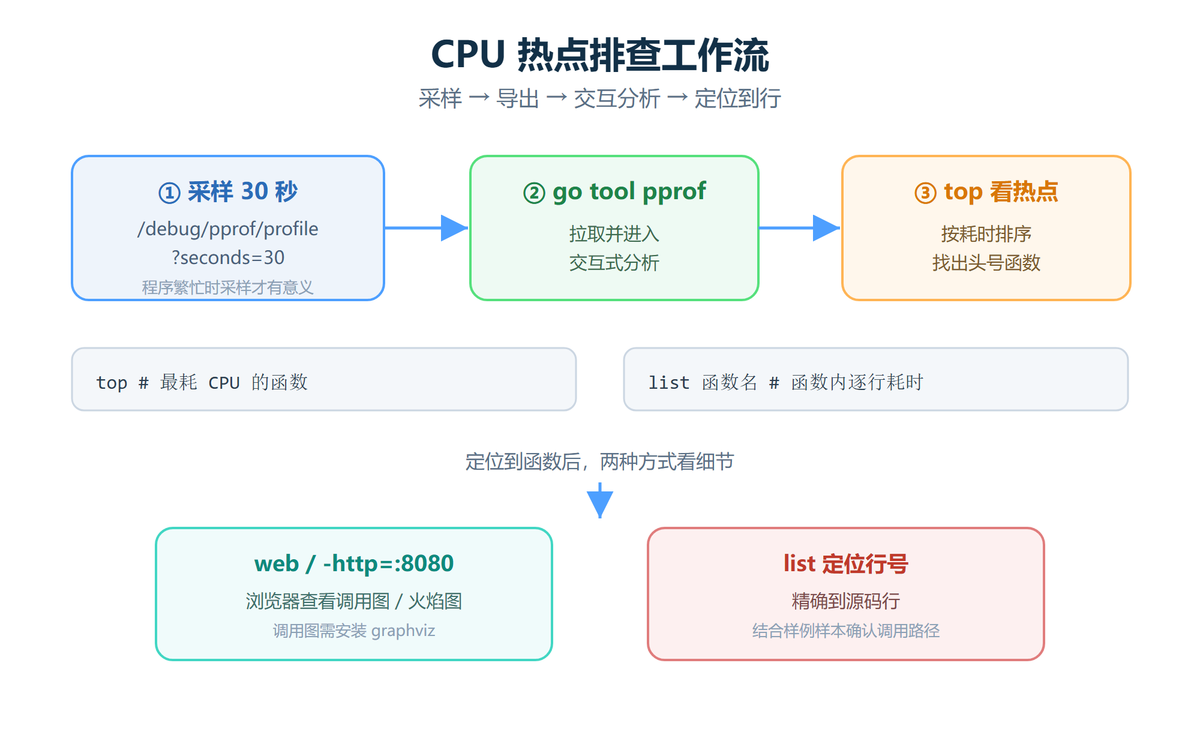
# 采集 30 秒 CPU profile 并进入交互式分析
go tool pprof http://localhost:6060/debug/pprof/profile?seconds=30

# 交互命令
top            # 最耗 CPU 的函数
list 函数名     # 函数内部逐行耗时
web            # 生成调用图(需安装 graphviz)
定位流程:先 top 找热点函数,再 list 精确到行。想直观看调用路径,用 -http=:8080 开浏览器火焰图。
内存分析
go tool pprof http://localhost:6060/debug/pprof/heap

# 交互命令
top -cum   # 按累计分配排序
list       # 函数内部逐行分配
# 用 -http 直接在浏览器里看火焰图/调用图
go tool pprof -http=:8080 http://localhost:6060/debug/pprof/heap
Goroutine / 阻塞分析
go tool pprof http://localhost:6060/debug/pprof/goroutine   # 看 goroutine 最多的调用栈
go tool pprof http://localhost:6060/debug/pprof/block       # 看阻塞热点
代码内手动采集
不想开端点时,直接在代码里写文件:
// CPU
f, _ := os.Create("cpu.prof")
pprof.StartCPUProfile(f)
defer pprof.StopCPUProfile()

// 内存快照
f, _ := os.Create("mem.prof")
pprof.WriteHeapProfile(f)
f.Close()
基准测试里的 pprof
func BenchmarkX(b *testing.B) {
    f, _ := os.Create("bench.prof")
    pprof.StartCPUProfile(f)
    defer pprof.StopCPUProfile()
    for i := 0; i < b.N; i++ {
        // 被测代码
    }
}
排查案例
内存泄漏
# 采集两个时间点的 heap,对比增长
go tool pprof -http=:8080 http://localhost:6060/debug/pprof/heap
heap profile 显示的是分配而非当前占用。泄漏的特征是”累积分配持续增长且不回收”。做法:t1、t2 各导一份 profile,用 -base 参数对比,只看增量来自哪些调用点。
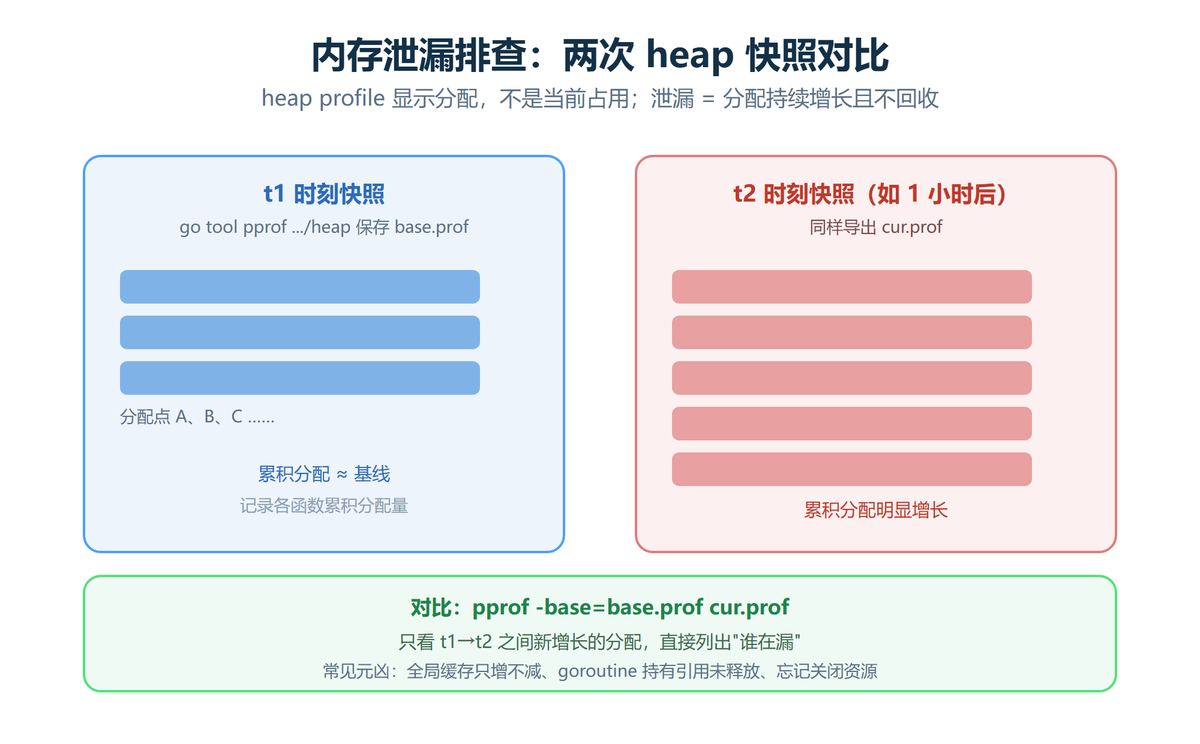
常见元凶:全局缓存只增不减、goroutine 长期持有引用、资源忘记关闭。
CPU 热点
go tool pprof http://localhost:6060/debug/pprof/profile?seconds=30
# top 看热点函数,list 定位到具体行
注意事项
- 默认 CPU 采样频率 100Hz;阻塞/互斥分析需要先设置采样率:
runtime.SetBlockProfileRate(1)、runtime.SetMutexProfileFraction(1); - heap profile 显示的是分配情况而非当前占用,区分”累积分配”和”存活”两个视图;
- 生产环境开 pprof 端点要注意:只绑内网地址或加鉴权,否则任何人都能拉取 profile;
- 采样时长一般 30–60 秒,程序繁忙时分析最有意义。